Interesting statistics from the elections..
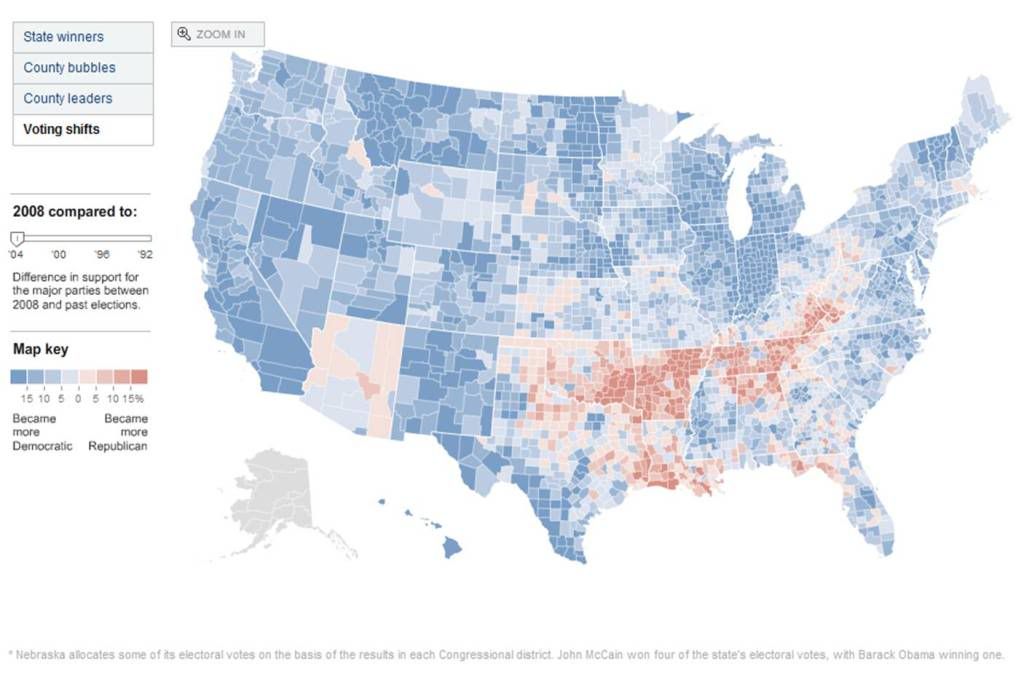
There’s lots of discussions going on about what the Republicans could’ve/should’ve done different this past election. Arguing about that stuff aside, here’s an interesting map I found today on the NY Times. Chris Matthews (MSNBC) made reference to it earlier on his broadcast.
Now, the idea here is, compared to how these counties voted last time (2004 presidential election), how did they vote this time?

In other words, there’s this little band across OK – AR – TN – KY, and of course my own home state of Louisiana, that got more Republican. Everyone else seems to have gotten more Democratic. If this is the result of the Republican party catering to it’s "core", then I would conclude that their core is pretty limited, both in numbers and geographically. Just a thought here, but it seems to me that this "core" are more extremists than a core constituency. I would have figured that my "core constituents" were the folks who made up most of my party. If that’s really what it means, then the Republican party is in pretty bad shape.
Can’t we find some politicians or parties who want to advance the ideas and beliefs that most of us share, whatever those ideas and beliefs are?
Aiey.
wow that’s kind of interesting to look at
Warning Comment
ryn: I’ve never agreed with the link between religion and marriage. I guess we could argue that all marriages are civil unions, but not all civil unions are marriages, but does that make one less meaningful than the other? We could also define marriage as a linking of two people, one of whom has a penis and the other a vagina, but that’s a bit clinical. But it’s hard to deny that the concept started as a heterosexual institution.
Warning Comment
Cool map, and encouraging, but for instance those “bluest” parts of Wyoming on that map still went 2-1 against Obama. Wyoming, Michigan, in contrast, went from 3-2 against Kerry to even up for McCain and Obama. It’s where the original Puritans live. That really tickles me.
Warning Comment
RYN: Thank you for your note at BHF; I had no idea that Maryland is proposing that, because that’s exactly what my husband & I are trying to get through people’s heads – This is fantastic, I will go research more!!
Warning Comment
Interesting that IMHO- the states that became more republican are basically part of the bible belt where homophobia and racistism runs rampant. I just know damn well those red areas are because Obama is black (well mixed- but considered black). It’s all so insane. Um the note telling us that the concept of marriage was started as a heterosexual institution is because people had to evolveenough to see that that the christian religion is a pick and choose religion- changed to suit different people’s likes and dislikes. Homosexuality has a long history of perversion as far as the christians are concerned. Ugh- don’t get me started on THAT.
Warning Comment
Your note to BedlamHillFarm was brilliant. I vote you for President next time. 😉 I’ve never a better idea then to make everyone else change their “marriage” to be a “civil union”. If you want a marriage- do it with the church. If you want the benifits of being married- EVERYONE should be in a civil union recognized by our country. I love it! THAT is equal rights for all and getting the damn religions seperated from state as it should be.
Warning Comment
RYN: *Grins* Dr Horrible is awesome! ‘Look at my wrist, I have to go!’
Warning Comment
Green used to be my favorite color, but right now I think blue is!
Warning Comment
I didn’t think ANYONE got more Republican… thanks for the info.
Warning Comment
I’ve seen that map. My dad and i refer to that band of red as “The Idiot Belt” when we’re feeling exceptionally cynical.
Warning Comment
RYN: Book. Eyes Like Stars, the first book in the Theatre Illuminata series by Lisa Mantchev.
Warning Comment